


AI in Mineral Exploration: What the Data Actually Tells You
There is a lot of noise right now about AI in mineral exploration. Vendors are promising faster discoveries, smarter targeting, and models trained on the “world’s richest database.” Some of that is real. Some of it is a platform looking for a problem.
After nearly two decades applying remote sensing, GIS, and predictive analysis to exploration projects across the Americas — from the boreal forests of Quebec to the porphyry belts of the Central Andes — I want to share what actually works. Not what sounds good in a demo. What produces results when the drill bit goes in the ground.
Three recent projects illustrate this better than any slide deck.
The Abitibi Project, Quebec, Canada — Lithium in a Vegetated Shield Terrain
Early-stage spodumene pegmatite project in the eastern Abitibi Belt. 155 exploration claims, roughly 10,670 hectares. Dense boreal vegetation cover. That last detail matters more than most people expect.
When you fly a satellite over the Canadian Shield in summer, what you see is trees. A lot of them. Traditional optical remote sensing struggles badly here — vegetation masks the spectral signatures of the rocks below, and standard hyperspectral processing generates false oxide responses that send you in the wrong direction. Most generic AI platforms don’t solve this. They just pass the noise through a fancier model.
Our approach started with data selection. We used Landsat-5, Landsat-8, Sentinel-2, ASTER, and WorldView-2 — each chosen for specific spectral properties relevant to Li-bearing pegmatites, not just because they were available. ASTER was critical for its SWIR bands covering mineral absorption features in the 2.1–2.4 μm range, where spodumene, lepidolite, and montebrasite have diagnostic signatures. WorldView-2 added the spatial resolution needed to detect smaller pegmatite bodies.
We masked vegetation using NDVI thresholds calibrated per sensor — 0.2 for ASTER, 0.25 for Landsat-5, 0.3 for Landsat-8 — because applying the same threshold across sensors introduces its own errors. We built custom RGB band combinations specifically for Li-bearing mineral discrimination, not adapted from gold or copper literature. Band ratios were constructed around the actual reflectance curves of spodumene, lepidolite, and cookeite, tested against spectral libraries and adjusted for local atmospheric conditions.
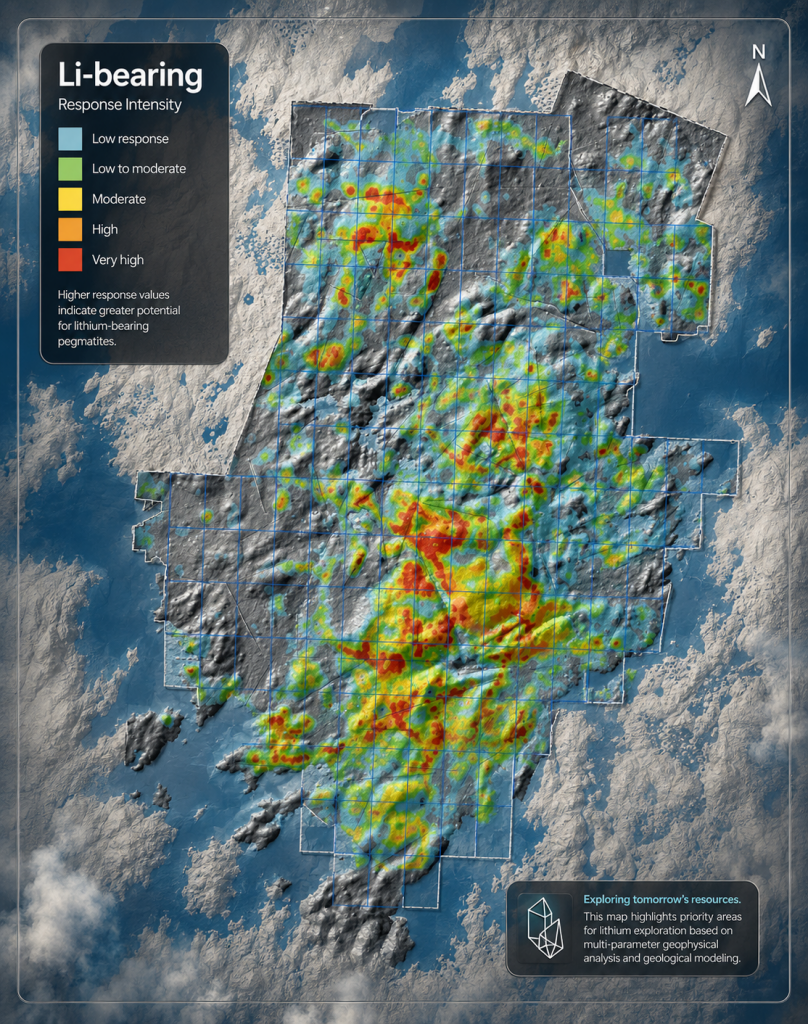
The key breakthrough was integrating airborne radiometric data — potassium (K), uranium (U), and thorium (Th) channels — with the satellite imagery. Where optical sensors saw trees, radiometric data captured the geochemical signature of the rocks beneath. Magnetic data added structural context. We then applied Fuzzy Logic AI to synthesize all layers simultaneously, handling the uncertainty inherent in multi-source remote sensing without forcing a binary classification the data couldn’t support.
The result: a mineral potential map showing coincident K anomalies and low vegetation response — a proxy for near-surface pegmatite-bearing ground — validated against field control points. No field campaign was needed to generate the first set of targets.
The Montauban Project, Quebec, Canada — Deep Gold with Ambient Noise Tomography
This one is publicly disclosed, so I can be specific.
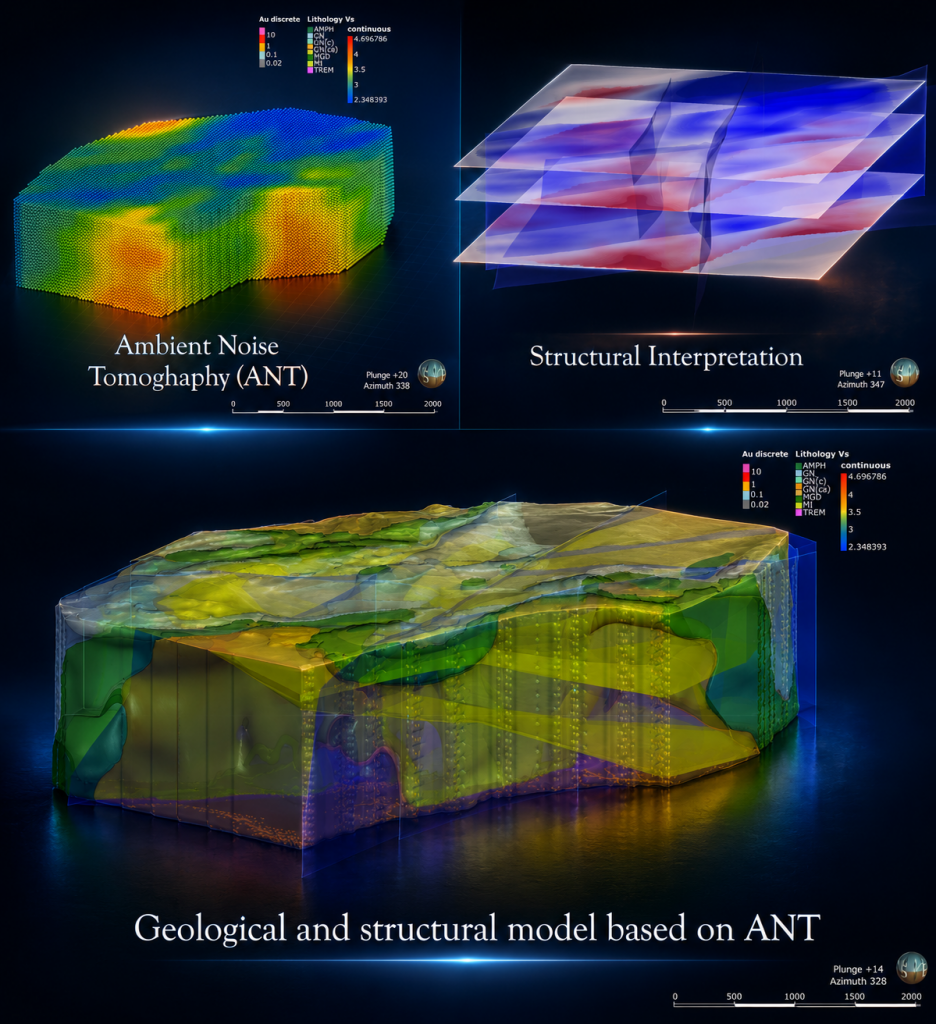
Earlier this year, Geomatic World and CAUR Technologies jointly delivered an Ambient Noise Tomography (ANT)-based 3D geological model for ESGold Corp.’s Montauban gold-silver project in Quebec. The result: a mineralized corridor identified to approximately 900 metres depth — significantly deeper than any previous exploration on the property, where historical drilling rarely exceeded 50 metres and the deepest holes reached only 250 metres. The model also outlined approximately 2 kilometres of strike length, with mineralization appearing to widen at depth.
ESGold disclosed this publicly in a press release in February 2026.
ANT is a passive seismic method that uses ambient ground vibrations — traffic, wind, microseismic activity — to image subsurface density contrasts and structural features. No active seismic source. No explosives. No drilling required to see what’s there. CAUR Technologies acquired the seismic velocity data using their proprietary instrument and processing stack. Geomatic World built the 3D geological model from that data, integrating it with our remote sensing and structural interpretation to produce a model that guides exploration targeting at depth.
This is what the CAUR partnership delivers in practice. CAUR Technologies is affiliated with Geophysics GPR International, with active operations across North America, South America, Africa, and Asia. That network, combined with Geomatic World’s AI remote sensing and predictive analysis capabilities, means we can take a project from surface spectral mapping to deep subsurface imaging in a single integrated workflow — without the client assembling three separate vendors.
The Cajamarca Project, Peru — Porphyry Cu-Au in the Northern Andean Belt
Different hemisphere, different geology, different data environment — same methodology logic.
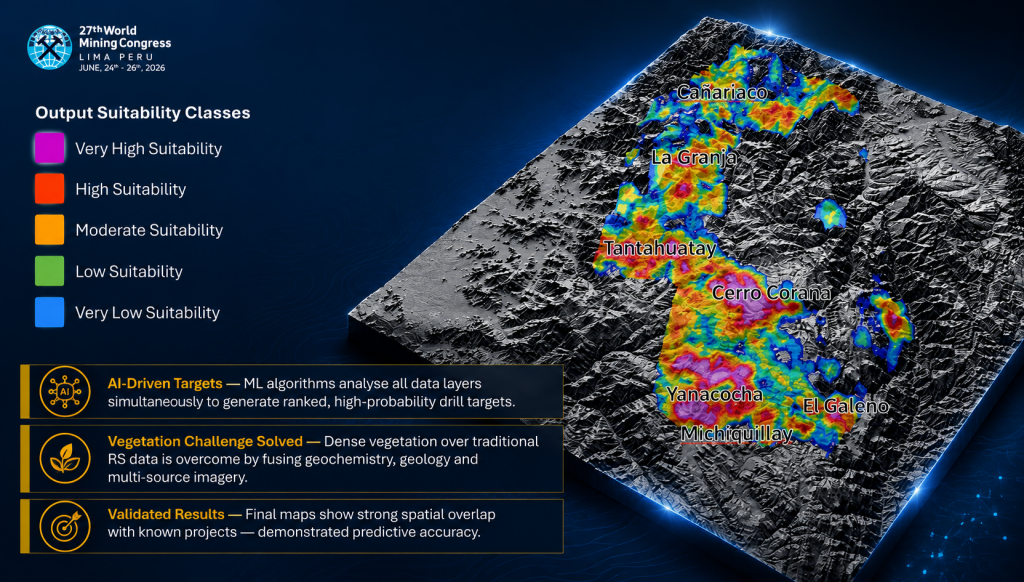
The Cajamarca region in northern Peru sits in one of the most prolific metallogenic belts in the world. Porphyry copper-gold systems, epithermal overprints, intense hydrothermal alteration. The geological signal is strong. But so is the complexity: multiple alteration phases, structural overprinting, variable erosion levels, and publicly available data with highly variable quality.
This project was developed in collaboration with IAMGOLD Peru. The starting point was not a generic global database — it was our own Andean-scale dataset built over years of fieldwork, remote sensing interpretation, and project-level geological modeling across Peru, Chile, and Argentina. That regional context is not something you can download. It comes from understanding why a potassic halo looks different in a Miocene porphyry in Cajamarca versus an Eocene system in southern Peru, and calibrating your model accordingly.
We processed ASTER data for hydrothermal alteration mapping — argillic, phyllic, and potassic zones — and integrated aeromagnetic data to identify the structural architecture hosting mineralization. The predictive analysis used AI methods to weight and combine these inputs against our regional metallogenic knowledge, producing a ranked target map with explicit confidence zones rather than a single heat map.
The value for IAMGOLD was not just the map. It was the ability to explain why each target ranked where it did, trace the geological reasoning behind the model output, and adjust the analysis when new drill data came in. That kind of transparency is what technical teams need before they commit drill programs.
This project is also the basis of the technical presentation we will deliver at the World Mining Congress 2026 in Lima later this month — one of the most rigorous technical forums in the global mining industry. We were invited to present because of results, not because of a marketing budget.
What These Projects Have in Common
Three projects. Two countries. Three geological systems — Li pegmatites in boreal shield, deep gold in Precambrian basement, porphyry Cu-Au in the Andes. The methodology adapts to each one.
Data selection is driven by the mineralogy and environment of the specific system, not by what is generically available. Pre-processing is calibrated to local conditions, not applied from a template. AI tools are chosen for their capacity to handle uncertainty honestly — Fuzzy Logic does not pretend the data is cleaner than it is. Regional geological context is built over years; it cannot be replaced by a global training dataset.
A model is only as good as the geological logic behind it. A platform that runs your data through a pre-trained model and returns a heat map is useful for a first pass. It is not a substitute for an interpreter who understands the mineral system, the data limitations, and the structural geology of the district.
The other thing all three projects share: each client received a complete technical report, signed by a P.Geo., explaining the methodology, data sources, processing steps, and interpretation. Not a dashboard. A defensible document.
A Note on Data Confidentiality
Two of the three projects above are referenced by region rather than client name. Exploration data is strategic. Our clients’ proprietary information — claim boundaries, drill results, identified targets — does not leave a bilateral confidentiality agreement. It does not feed a third-party database. It does not improve someone else’s model.
When you hand your project data to a SaaS platform, read the terms carefully. Understand what “anonymized and aggregated” means in practice. It is a legitimate question to ask any AI vendor, including us.
We are a small company. No $30M Series B. No booth at every conference. What we have is twenty years of applied geoscience, a strategic partnership with CAUR Technologies, a proprietary Andean-scale database, and results that hold up when the drilling starts.
Geomatic World works with junior and mid-tier exploration companies across North, Central, and South America. Our four core services — Geo-AIRS AI Remote Sensing, GeoWorld Insight Technology, GeoWorld Insight GIS-Database, and GeoWorld Geological Modeling — are delivered as complete technical products, not platforms to learn.
If your project has messy data, complex geology, dense vegetation, or ground nobody has imaged at depth — that is exactly where we work best.
Also available in / Également disponible en / También disponible en: 🇫🇷 Lire en français · 🇪🇸 Leer en español
P.Geo., Eng., MSc. Santiago Mayor Founder & CEO, Geomatic World Inc. Montréal, Canada santiago_mayor@geomaticworld.com | www.geomaticworld.ca
Leave a Reply